The Change of Tide and Tidal Current Due to the Development of the Kwangyang Bay, Korea
Abstract
The Kwangyang Bay (KB), located in the south sea of Korea, has been undergoing severe environmental changes due to the construction of Kwangyang Harbor started in 1982. A three-dimensional layer-level hybrid model developed by Kim et al. (1999) was applied to the KB to estimate the impact of the development of the bay. The simulations were performed to quantify the changes of tidal elevation, tidal current and tidal residual current before and after the development of the KB. In addition, extensive and intensive field measurements on the hydrodynamic conditions have been carried out around the KB from December 1995 to March 2008. Tidal currents at the bay entrance (Yeosu Channel) after the development of the KB decreased whereas the currents at the northern (Sumjin River estuary) and the eastern (Noryang Channel) parts of the bay showed increase compared to the condition before the development. The tidal elevations after the development at all comparison Stations increased as compared with those before the development.
초록
한국의 남해안에 위치한 광양만은 1982년에 시작된 광양항의 건설로 인해 심각한 환경변화를 겪고 있다. 광양만의 개발로 인한 물리적 영향을 평가하기 위해 김 등(1999)에 의해 개발된 3차원 layer-level 혼성 해수유동 모델을 광양만에 적용하여 광양만 개발 전·후의 조위, 조류 및 조석잔차류의 변화특성을 시뮬레이션하였다. 또한, 1995년 12월부터 2008년 3월까지 주변해역에서 광범위한 해수유동이 조사되었다. 광양만 개발 후 광양만의 입구인 여수수로에서 조류는 광양만 개발 전에 비해 감소하였으나, 광양만의 북측인 섬진강으로 향하는 흐름과 동측인 노량수로로 향하는 흐름은 개발 전에 비해 증가되었다. 조위는 모든 비교 정점에서 개발 후가 개발 전에 비해 증가되었다.
Keywords:
Kwangyang Bay, tide, tidal current, numerical model키워드:
광양만, 조석, 조류, 수치모델1. Introduction
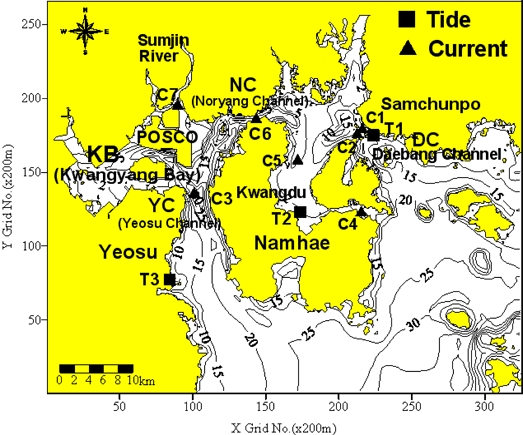
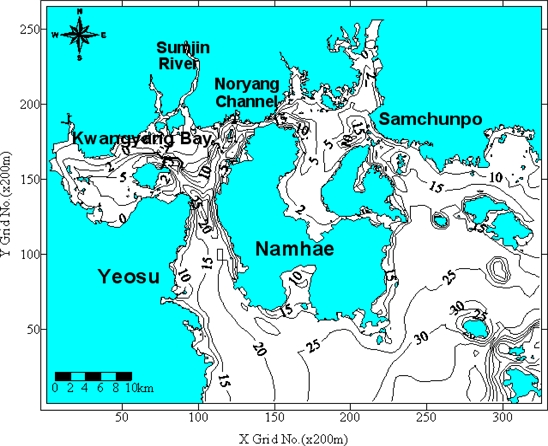
Kwangyang Bay (hereafter, KB) is located in the central south sea of Korea, and the water exchange of the bay with the ocean occurs through Yeosu Channel (hereafter, YC) and Noryang Channel (hereafter, NC) (see Fig. 1). The geometry is complex and the depth is less than 35 m in general. The width at the narrowest site of the NC is about 500 m, and the narrowest width of the YC is about 3 km. The bay is connected to the Sumjin (Seomjin) River toward the north. The averaged annual discharge of the Sumjin River is about 120 m3/sec, and the design flood discharge of 100 years occurrence frequency is 12,000 m3/sec. The KB has been undergoing severe topographic and geographic changes due to the construction of Kwangyang Harbor started in 1982. The expansion projects of the Kwangyang Harbor for the container and dumping sites are in progress. The intertidal flat in Sumjin River estuary has been destroyed due to sand mining and dredging. The depth (Fig. 1) after the development of the KB is deeper than that (Fig. 2) before the development. The water depth before the development in Sumjin River estuary is less than 1 m, and suitable for navigation of small ships only, whereas the depth after the development is more than 3 m due to the dredging for the construction of the Kwangyang Harbor. Compared with the condition before the development of the KB, the salt intrusion has strongly developed to the upstream part of the Sumjin River, and therefore groundwater is suffering the salt pollution from sea water(Lee et al.[2008]; Na and Son[2005]; Noh et al.[2011]; Lee et al.[2022]). This study is focused to understand the changing conditions of tide, tidal current and tidal residual current due to the development of the KB using a three-dimensional numerical model(Kim et al.[1999]). Kim[2003, 2005] investigated the hydrodynamic, water quality and sediment transport in the KB using the 3-D layer-level hybrid model developed by Kim et al.[1999]. Kim et al.[2010] analyzed the water circulation structure in the Chinju (Jinju) Bay, and Kim[2013] carried out the 3-D numerical simulations of the hydrodynamic circulation and the impact of the freshwater runoff in the Chinju Bay. Kim et al.[2002] used 3-D model to investigate tidal current change and effluent pattern from Sumjin River due to the development of the KB. Ro[2007] analyzed the characteristics of tidal and sub-tidal currents in the Kangjin Bay, and Ro et al.[2010] carried out numerical modeling experiments to study the impact of the dam water discharge on the circulation system in the Kangjin Bay. Kim et al.[2008] studied three-dimensional mixing characteristics in Seomjin (Sumjin) River estuary using the EFDC model and seasonal field data during spring tide. Kang et al.[2011] simulated three-dimensional ocean circulation patterns using the EFDC model in the KB and Jinju (Chinju) Bay. Kim et al.[2014] used ECOM-3D to investigate the circulation characteristics in Kwangyang Estuarine system. The main purpose of the present study is to simulate the tidal elevation, tidal current and tidal residual current before (Fig. 2) and after (Fig. 1) the development of the KB using 3-D hybrid model (Kim et al.[1999]), and to estimate the impact of the development of the KB.
2. Field Measurements
Tidal elevations at Sts. T1 and T3 (Fig. 1) were observed at a time interval of 10 minutes with SBE 26 tide gauge (made in USA). The measurements at Sts. T1 and T3 were carried out in period of December 2, 1995 ~ January 11, 1996, and the data at St. T2 (Fig. 1) are those obtained from KHOA (Korea Hydrographic and Oceanographic Agency) during the same period (Kim et al.[2002]).
Flow velocity was measured at a time interval of 10 minutes with ADCP and RCM-9 current meters. The measurements of the flow velocity at St. C3 (Fig. 1) were carried out in the period of December 2, 1995 ~ January 11, 1996, and the measurements at St. C6 (Fig. 1) were carried out on November 22 ~ December 13, 1998, May 7 ~ May 26, 2005 and January 29 ~ March 1, 2008. More detailed informations on the field work and the data are given in Kim et al.[2002] and Kim et al.[2010].
3. Numerical Model
3.1 Governing equations
Assuming the hydrostatic pressure distribution and the Boussinesq approximation, the governing equations in a three-dimensional (x, y, z) coordinate system with z-axis vertically upwards are:
| (1) |
| (2) |
| (3) |
| (4) |
where u, v and w are the velocity components in x, y and z directions respectively; t is the time; p is the pressure; f is Coriolis parameter as 2Ωsinθ where θ is the latitude; Ω is the angular speed of earth rotation; g is the gravity; ρc is the reference density; ρ is the water density; εx, εy and εz are the turbulent eddy coefficients in x, y and z directions, respectively. After substituting equation (4) into equations (2) and (3), and taking the vertical integration of equations (1) to (3) for the kth layer, and also using a streamline condition at the surface and the bottom, the governing equations become:
| (5) |
| (6) |
| (7) |
where ζ is the displacement of the free surface; h is the layer thickness; η is the elevation of internal wave; and b represents the bottom layer. The integrated mass conservation equation of salinity transport for the k-th layer is
| (8) |
where S is the salinity; Dx and Dy are horizontal eddy diffusivity; Dz is the vertical eddy diffusivity.
The continuity equation for the computation of internal elevation is
| (9) |
where Q is the transport flux of water mass from lower layer to upper layer, and Q can be written as
The vertical velocity can be computed as
| (10) |
3.2 Numerical solution
The KB was simulated with a three-dimensional numerical model (Kim et al.[1999]; Kim et al.[2002]; Kim[2003]; Kim[2005]; Kim[2013]) using an ADI (Alternating Direction Implicit) finite difference scheme. The time step is 20 sec (based on the CFL condition), the horizontal grid size is 200 m, and the area is discretized by 260 × 325 points in the horizontal and 4 layers over the depth, the vertical grid size varies from 2 to 10 m. The land boundaries are assumed impermeable where the normal component of velocity is set to zero. On river boundaries, the flow rate is given as 120 m3/sec. At closed boundaries the transport of substance is zero. At an open boundary the concentration must be specified during inflow. On outflow the substance is advected out of the model domain. In order to drive the hydrodynamic model, water elevation data were used at seaward boundary. The open boundaries for each grid are forced by linear interpolation with M2, S2, K1 and O1 tidal constituents.
4. Results and Discussions
4.1 Measured tidal height
Tides in the KB are predominantly semi-diurnal. The results of harmonic analyses of tides at Sts. T1, T2 and T3 are compared in Table 1 (Kim et al.[2002]). Only 4 constituents (M2, S2, K1 and O2) are presented. Amplitudes of M2-tide are everywhere predominant, and S2 components are approximately one-half of the M2 components. The amplitudes of two diurnal components, O1 and K1, are very small. Tides at Yeosu Harbor (St. T3) lag behind those at Samchunpo (Samcheonpo) Harbor (St. T1) by 38.3 minutes for M2-tide.
4.2 Measured tidal current
Extensive and intensive measurements during long period were carried out at Sts. C1, C2, C3 and C6 (Kim et al.[2002]; Kim et al.[2010]. Table 2 is the result of harmonic analysis for tidal current at the 5 m depth of St. C6. M2 and S2 amplitudes are 73.92 and 41.48 cm/sec, respectively. M2 and S2 amplitudes at St. C1 (Table 3) are 90.26 and 37.54 cm/sec, respectively. Tidal form factors at Sts. C6 and C1 are 0.13~0.18 and 0.10~0.11, respectively (Kim et al.[2010]). The semi-diurnal tidal currents are dominated, and the S2 components are approximately one-half of the M2 components.

Harmonic constants of the east-west component of tidal current at St. C6 during August 31~October 2, 2007 (Kim et al.[2010])
4.3 Comparisons of tide and tidal current
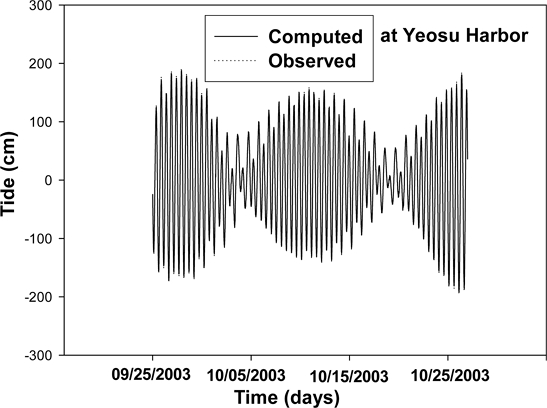
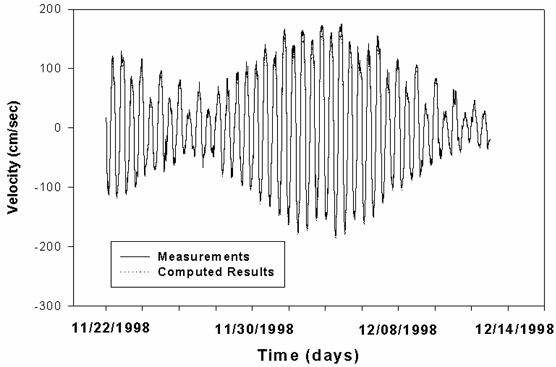
The computations were conducted to reproduce the tidal elevation during the period from September 25 to October 26, 2003 at St. T3 (Yeosu Harbor). Fig. 3 shows a comparison of measured and computed tidal profiles at Yeosu Harbor. The computed tidal profile is in good agreement with the measurements. Fig. 4 shows that the computed profiles of tidal currents at St. C6 (NC) are in good agreement with the measurements. The solid line is the computed results and the dotted line is the measurements.
The model was validated using tidal elevation measurements at St. T3 (Yeosu Harbor), and velocity measurements at the NC. The model successfully reproduced the tidal profile at St. T3 and the current profile observed at the NC (St. C6).
4.4 Computed tidal current
A 3-D numerical model was used to estimate the impact of the development of the KB. The water elevations were initially set to mean water level everywhere and the initial velocities were set to zero. The initial salinity level was set at 32 ppt everywhere. The predicted results were verified with field observations. The model was run with four tidal harmonic constants (M2, s2, K1 and O1) for 31 days. The system went to equilibrium after about one tidal cycle.
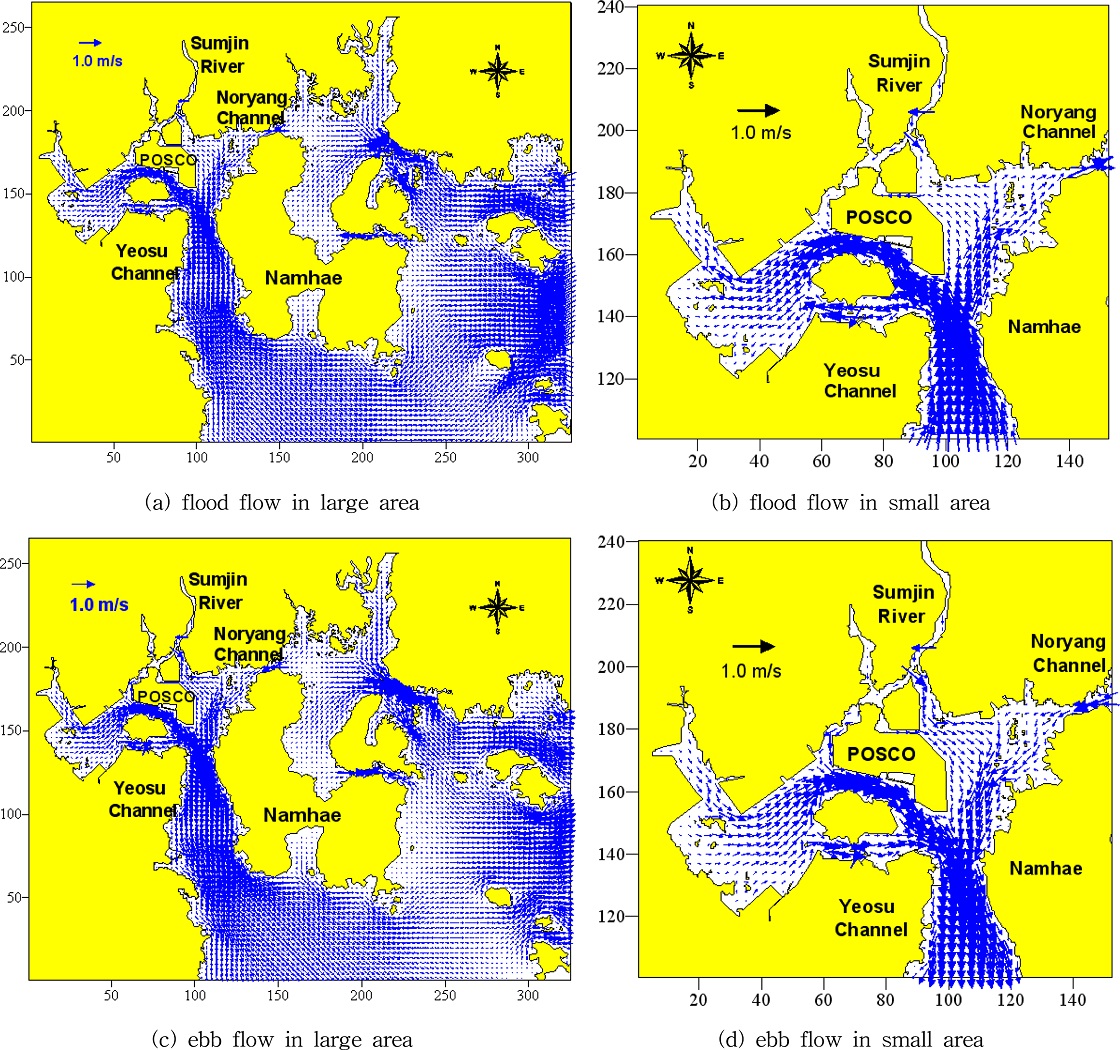
Fig. 5(a, b, c and d) and Fig. 6(a, b, c and d) show the computed current fields at the surface layer during the spring flood tide and the ebb tide in large and small area before and after the development of the KB, respectively. The tidal currents at the YC are predominantly north-south directions, whereas the currents at the NC are east-west directions, and in general, the currents parallel to the coastlines. Upstream of the KB mouth is divided into tri-direction (westward, northward and eastward) during flood tide and this pattern is reversed during ebb tide. The flood flow at YC is northward, whereas the ebb flow is southward. The highest velocity occurs at the NC (St. C6), whereas the velocity at the central part of the KB is much smaller than at the YC and the NC during the flooding and ebbing. The maximum current speed at the YC during flood tide is 86 cm/sec, and the maximum speed during ebb tide reaches up to 96 cm/sec. The observed maximum current speed during the spring tide at the NC is approximately 1.8 m/sec westward, whereas the computed maximum velocity is approximately 1.9 m/sec westward. The ebb velocity is usually larger than the flood velocity, and the tidal flow during wet season is stronger than during dry season. Due to the influence of the river inflow and the action of the bottom resistance, the tidal wave in Sumjin (Seomjin) River estuary deforms during the upstream propagation, resulting in shorter flood duration and longer ebb duration.
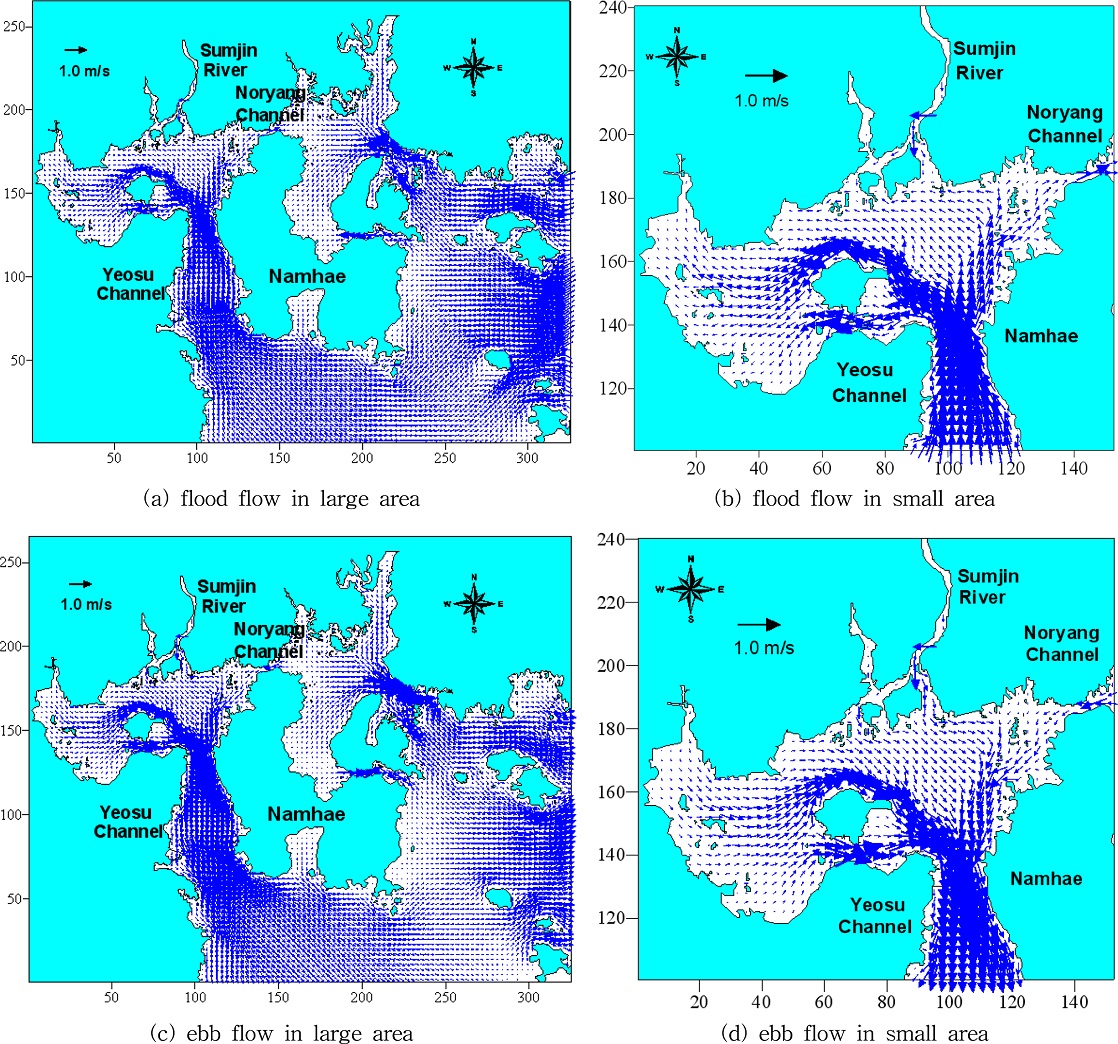
Computed velocity fields at surface layer during the spring tide in large and small area before the development of the KB.
4.5 Comparisons of hydrodynamic change before and after the development
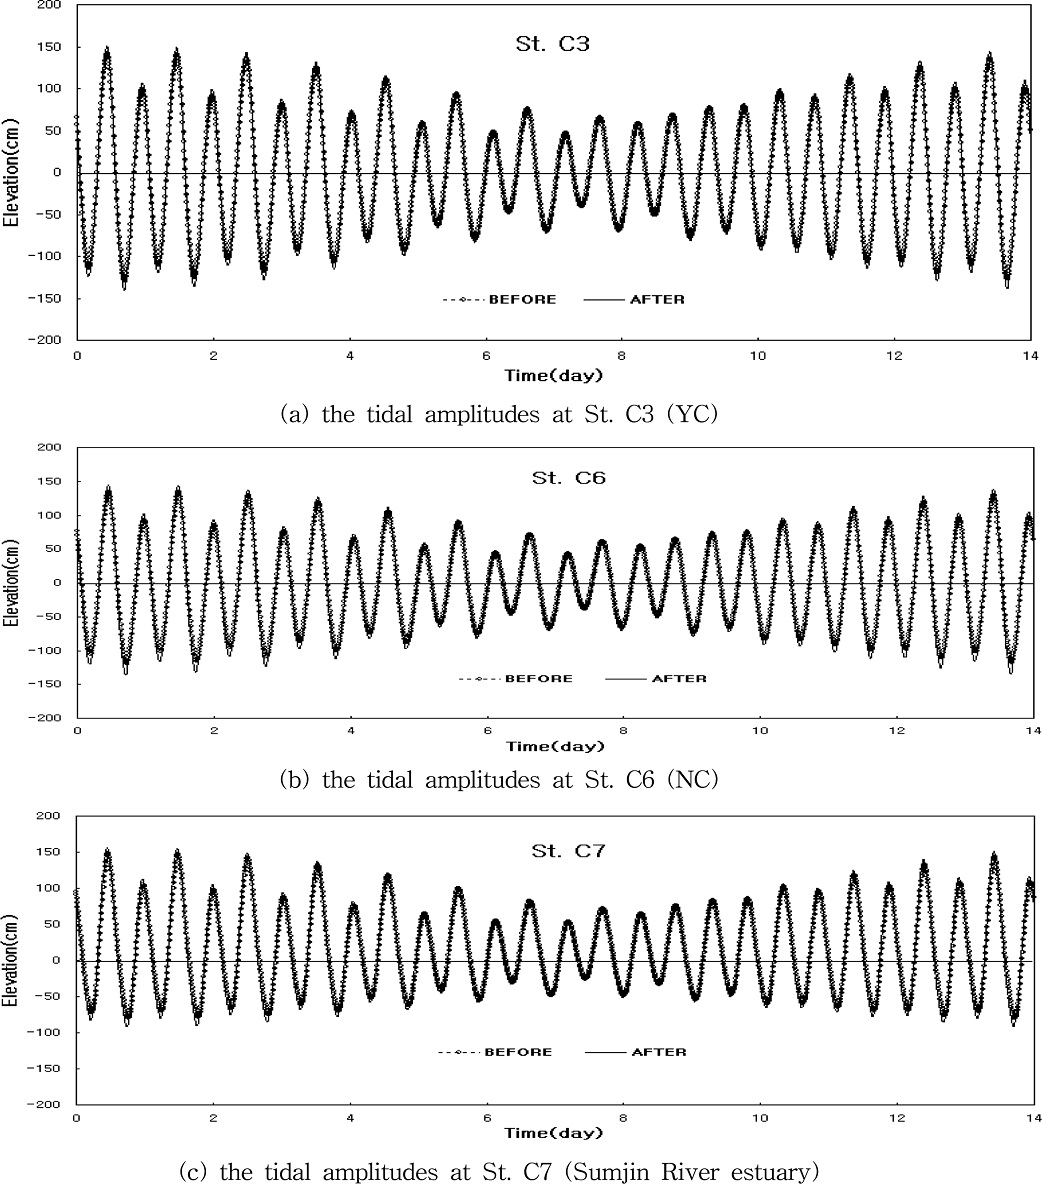
Fig. 7(a, b and c) show the computed velocity profiles before and after the development of the KB at the surface layer of Sts. C3 (YC), C6 (NC) and C7 (Sumjin River estuary), respectively. As the major component of the flow at the Sts. C3 (YC) and C7 (Sumjin River estuary) is a north-south velocity, the comparisons of the north-south component of the velocity are presented. Also, as the flow at St. C6 (NC) is predominant eastward during flood tide and westward during ebb tide, the comparisons of the east-west velocity are presented. The current speed after the development at St. C3 (YC) decreased as compared with those before the development due to the reduction of tidal volume at the bay entrance. The flow velocity after the development at St. C6 (NC) showed increase compared with those before the development. This phenomenon is attributed to the decreased tidal volume of the western KB due to the development. When the tidal current go to the KB, the current are divided into the tri-direction (northward, westward and eastward). After the development westward tidal volume decreased due to the reduced water area. Therefore, the tidal current go predominantly northward (St. C7) and the NC (St. C6). The flow after the development at St. C6 (NC) and C7 (Sumjin River estuary) is much stronger than before the development due to the increased tidal volume. Tidal volume after the development at Sts. C6 (NC) and C7 (Sumjin River estuary) increased whereas the volume at St. C3 (YC) decreased as compared with the volume before the development.
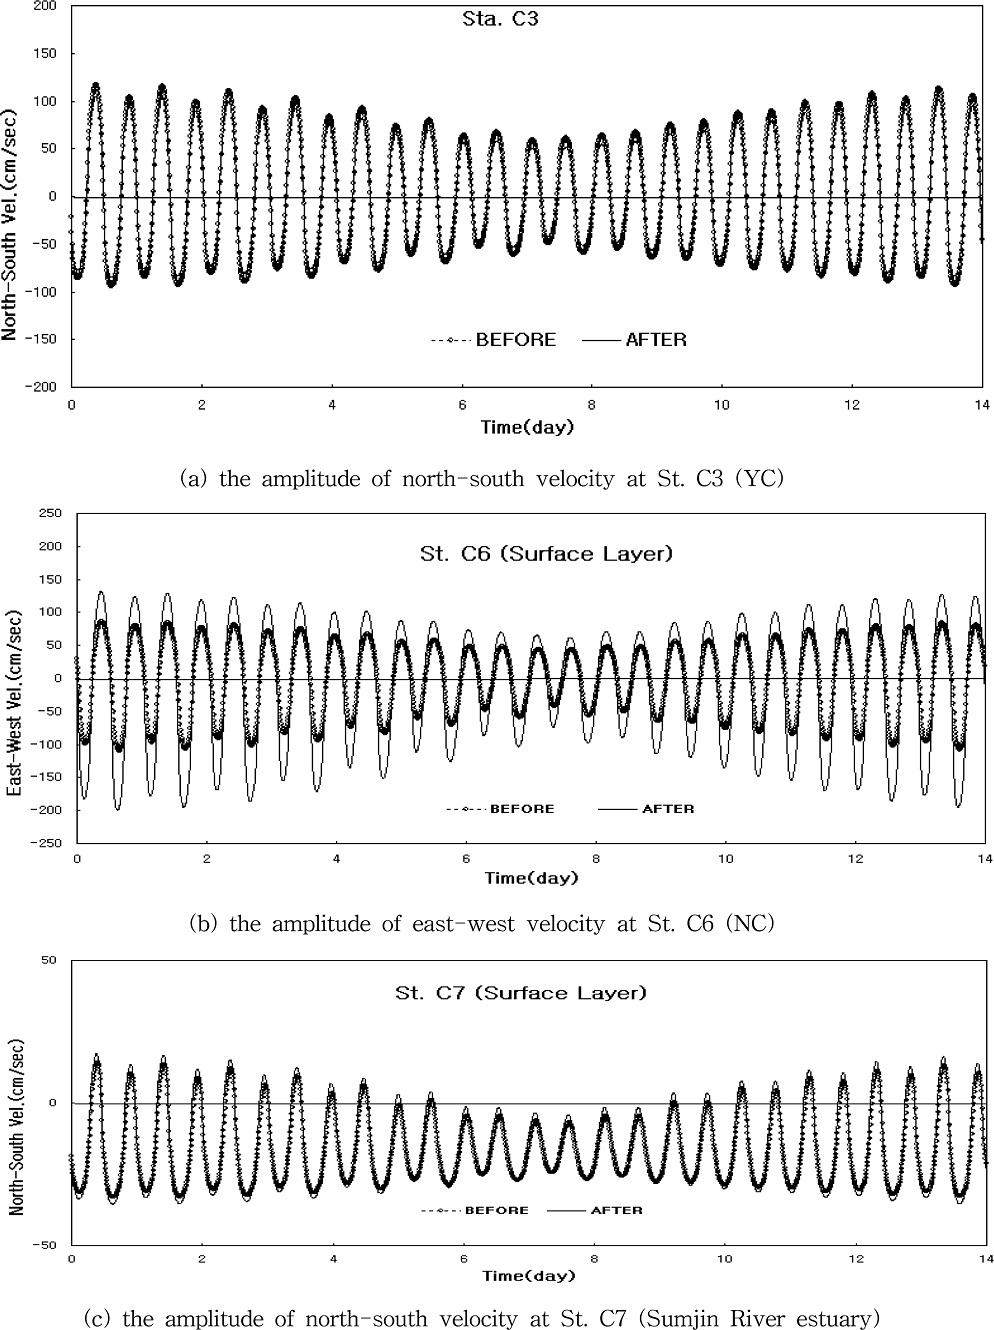
Comparisons of the current speed at Sts. C3 (YC), C6 (NC) and C7 (Sumjin River estuary) before and after the development of the KB.
Fig. 8(a, b and c) show the comparisons of tidal amplitudes at Sts. C3 (YC), C6 (NC) and C7 (Sumjin River estuary) before and after the development of the KB. The tidal elevations after the development at all Stations increased as compared with those before the development due to the decreased water area in the KB.
4.6 Computed tidal residual current
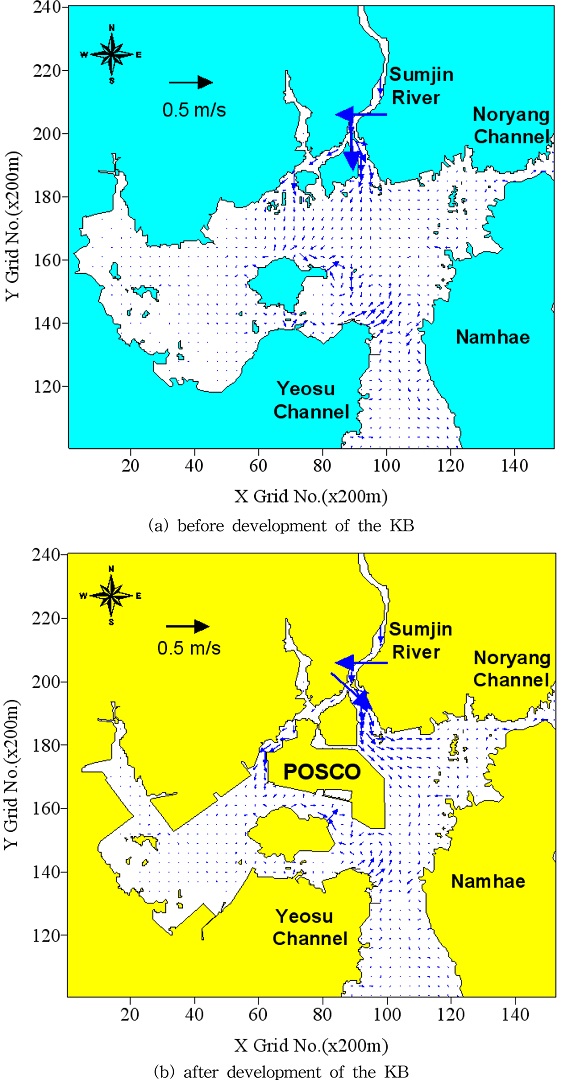
Fig. 9(a and b) show the computed tidal residual currents at surface layer before and after the development. The residual flow is strongest on the Sumjin (Seomjin) River estuary and is progressively weaker toward the south. The residual currents in Sumjin River estuary flow southward due to the discharge of the freshwater from the Sumjin River. The small scale eddy occurs at the west of the NC, and the residual currents at the northwestern part of the YC rotate counterclockwise throughout 30 days cycle. The residual currents at east side of the POSCO after the development are much stronger than before the development, and the increased currents can cause sediments to erode. The residual currents in the model domain vary greatly depending on the coastal structure after the development, the location and the bottom topography. Furthermore, the residual currents in Sumjin River estuary after the development were strengthened as compared with the residual currents before the development. Due to the influence of the river inflow, the ebb flow in Sumjin River estuary has been enhanced causing seasonal residual sediment transport(Kim[2005]). According to Choo[2002], the changes of kinematic energy including tidal residual currents, density currents and wind driven currents due to the coastal development of the KB were reduced by 10% compared with before the coastal development.
5. Conclusions
A three-dimensional layer-level hybrid model was applied to the KB located in the south sea of Korea to estimate the impact of the development of the bay. The simulations were performed to quantify the changes of tidal elevation, tidal current and tidal residual current before and after the development the KB. Tidal currents at the bay entrance (YC) after the development of the KB decreased whereas the currents at the northern (Sumjin River estuary) and the eastern part (NC) of the bay showed increase compared to the conditions before the development. The tidal elevations after the development at all comparison Stations (YC, NC and Sumjin River estuary) increased as compared with those before the development. This model can be used as an important tool to study the impact over hydrodynamic and ecological system which require further detailed investigation.
References
-
Choo, H.S., 2002, Numerical experiment for the changes of currents by reclamation of land in Kwangyang Bay, J. Environmental Sciences, 11(7), 637-650.
[https://doi.org/10.5322/JES.2002.11.7.637]

-
Kang, Y.S., Chae, Y. and Lee, H.R., 2011, Variation of density stratification due to fresh water discharge in the Kwangyang Bay and Jinju Bay, J. Korean Society of Coastal and Ocean Engineers, 23(1), 126-137.
[https://doi.org/10.9765/KSCOE.2011.23.1.126]

-
Kim, B.K., Ro, Y.J., Jung, K.Y. and Park, K.S., 2014, Numerical modeling of circulation characteristics in the Kwangyang Estuarine system, J. Korean Society of Coastal and Ocean Engineers, 26(4), 253-266.
[https://doi.org/10.9765/KSCOE.2014.26.4.253]

- Kim, C.K., 2003, Three-dimensional hydrodynamic and sediment transport modeling of Kwangyang Bay, South Coast of Korea, in proc. of ECM8, 27.
- Kim, C.K., 2005, Sediment transport and river plume modeling in the South Coast of Korea, ISOPE, Ⅰ, 645-649.
- Kim, C.K., 2013, Modeling hydrodynamic circulation and the impact of the freshwater runoff in the Chinju Bay, Korea, in proc. of ECM13, 1.
- Kim, C.K., Lee, J.C. and Ro, Y.J., 2002, Tidal current change and effluent pattern from Sumjin River due to the development of Kwangyang Bay, Symposium on Ocean Space Development and Environmental Preservation Countermeasure in the Southern Coastal Waters of Korea, University of Gyeongnam Namhae, 185-223.
- Kim, C.K., Lee, J.T. and Jang, H.S., 2010, Water circulation structure in the Chinju Bay of Korea, J. Korean Society of Coastal and Ocean Engineers, 22(4), 215-223.
- Kim, C.K., Yang, H.S. and Kim, K.C., 1999, Development of three-dimensional combined layer and level hydrodynamic model, J. the Korean Society of Civil Engineers, 19(Ⅱ-5), 603-614.
- Kim, J.K., Kwak, G.I. and Jeong, J.H., 2008, Three-dimensional mixing characteristics in Seomjin River Estuary, J. the Korean Society for Marine Environmental Engineering, 11(3), 164-174.
-
Lee, G.Y., Park, S.C., Park, S.H., Kim, E.S. and Lee, W., 2022, Evaluation of saltwater intrusion at the Sumjin River estuary by numerical model, Korean Society of Water Science & Technology, 30(6), 107-117.
[https://doi.org/10.17640/KSWST.2022.30.6.107]

-
Lee, S.B., Hong, C.O., Oh, J.H., Gutierrez, J. and Kim, P.J., 2008, Effect of irrigation water salinization on salt accumulation of plastic film house soil around Sumjin River estuary, Korean Journal of Environmental Agriculture, 27(4), 349-355.
[https://doi.org/10.5338/KJEA.2008.27.4.349]

- Na, C.K. and Son, C., 2005, Groundwater quality and pollution characteristics at Seomjin River basin: pollution source and risk assesment, The Korean Society of Economic and Environmental Geology, 38(3), 261-272.
- Noh, J., Lee, J.Y. and Shin, J.K., 2011, Analysis of saltwater intrusion by flushing discharge in the Seomjin River estuary, J. Environmental Impact Assessment, 20(3), 325-335.
-
Ro, Y.J., 2007, Tidal and sub-tidal current characteristics in the Kangjin Bay, South Sea, Korea, Ocean Science Journal, 42(1), 19-30.
[https://doi.org/10.1007/BF03020907]

-
Ro, Y.J. and Jung, K.Y., 2010, Impact of the dam water discharge on the circulation system in the Kangjin Bay, South Sea, Korea, Ocean Science Journal, 45(1), 7-25.
[https://doi.org/10.1007/s12601-010-0002-7]


